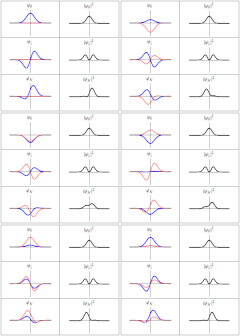
StationaryStatesAnimation.gif(300 × 280 Pixel, Dateigröße: 223 KB, MIME-Typ: image/gif, Endlosschleife, 41 Bilder)

Diese Datei und die Informationen unter dem roten Trennstrich werden aus dem zentralen Medienarchiv Wikimedia Commons eingebunden.

Zur Beschreibungsseite auf Commons


Beschreibung

Beschreibung
English: Three wavefunction solutions to the Time-Dependent Schrödinger equation for a harmonic oscillator. Left: The real part (blue) and imaginary part (red) of the wavefunction. Right: The probability of finding the particle at a certain position. The top two rows are the lowest two energy eigenstates, and the bottom is the superposition state , which is not an energy eigenstate. The right column illustrates why energy eigenstates are also called "stationary states".
Thus in every quantum stae,there are certain preferred positions of maximum probability
Datum
Quelle Eigenes Werk
Urheber Sbyrnes321
(* Source code written in Mathematica 6.0 by Steve Byrnes, Feb. 2011. This source code is public domain. *)
(* Shows classical and quantum trajectory animations for a harmonic potential. Assume m=w=hbar=1. *)
ClearAll["Global`*"]
(*** Wavefunctions of the energy eigenstates ***)
psi[n_, x_] := (2^n*n!)^(-1/2)*Pi^(-1/4)*Exp[-x^2/2]*HermiteH[n, x];
energy[n_] := n + 1/2;
psit[n_, x_, t_] := psi[n, x] Exp[-I*energy[n]*t];
(*** A non-stationary state ***)
SeedRandom[1];
psinonstationary[x_, t_] := (psit[0, x, t]+psit[1, x, t])/Sqrt[2];

(*** Put all the plots together ***)
SetOptions[Plot, {PlotRange -> {-1, 1}, Ticks -> None, PlotStyle -> {Directive[Thick, Blue], Directive[Thick, Pink]}}];
MakeFrame[t_] := GraphicsGrid[
   {{Plot[{Re[psit[0, x, t]], Im[psit[0, x, t]]}, {x, -5, 5}, PlotLabel -> Subscript[\[Psi],0]], 
     Plot[Abs[psit[0, x, t]]^2, {x, -5, 5}, PlotStyle -> Directive[Thick, Black],
		PlotLabel -> TraditionalForm[Abs[Subscript[\[Psi],0]]^2]]},
   {Plot[{Re[psit[1, x, t]], Im[psit[1, x, t]]}, {x, -5, 5}, PlotLabel -> Subscript[\[Psi],1]], 
     Plot[Abs[psit[1, x, t]]^2, {x, -5, 5}, PlotStyle -> Directive[Thick, Black],
		PlotLabel -> TraditionalForm[Abs[Subscript[\[Psi],1]]^2]]},
   {Plot[{Re[psinonstationary[x, t]], Im[psinonstationary[x, t]]}, {x, -5, 5}, PlotLabel -> Subscript[\[Psi],N]], 
     Plot[Abs[psinonstationary[x, t]]^2, {x, -5, 5}, PlotStyle -> Directive[Thick, Black],
		PlotLabel -> TraditionalForm[Abs[Subscript[\[Psi],N]]^2]]}
   }, Frame -> All, ImageSize -> 300];
output = Table[MakeFrame[t], {t, 0, 4 Pi*40/41, 4 Pi/41}];
SetDirectory["C:\\Users\\Steve\\Desktop"]
Export["test.gif", output]

Lizenz

Ich, der Urheber dieses Werkes, veröffentliche es unter der folgenden Lizenz:
Creative Commons CC-Zero Diese Datei wird unter der Creative-Commons-Lizenz „CC0 1.0 Verzicht auf das Copyright“ zur Verfügung gestellt.
Die Person, die das Werk mit diesem Dokument verbunden hat, übergibt dieses weltweit der Gemeinfreiheit, indem sie alle Urheberrechte und damit verbundenen weiteren Rechte – im Rahmen der jeweils geltenden gesetzlichen Bestimmungen – aufgibt. Das Werk kann – selbst für kommerzielle Zwecke – kopiert, modifiziert und weiterverteilt werden, ohne hierfür um Erlaubnis bitten zu müssen.

Kurzbeschreibungen

Ergänze eine einzeilige Erklärung, was diese Datei darstellt.

In dieser Datei abgebildete Objekte

Motiv

Dateiversionen

Klicke auf einen Zeitpunkt, um diese Version zu laden.

Version vomVorschaubildMaßeBenutzerKommentar
aktuell20:21, 20. Mär. 2011Vorschaubild der Version vom 20:21, 20. Mär. 2011300 × 280 (223 KB)Sbyrnes321{{Information |Description ={{en|1=Three wavefunction solutions to the Time-Dependent Schrödinger equation for a harmonic oscillator. Left: The real part (blue) and imaginary part (red) of the wavefunction. Right: The probability of finding the partic

Die folgende Seite verwendet diese Datei:

Globale Dateiverwendung

Die nachfolgenden anderen Wikis verwenden diese Datei: