Datei:Wrc.svg

Größe der PNG-Vorschau dieser SVG-Datei: 600 × 450 Pixel. Weitere aus SVG automatisch erzeugte PNG-Grafiken in verschiedenen Auflösungen: 320 × 240 Pixel | 640 × 480 Pixel | 1.024 × 768 Pixel | 1.280 × 960 Pixel | 2.560 × 1.920 Pixel
Originaldatei (SVG-Datei, Basisgröße: 600 × 450 Pixel, Dateigröße: 11 KB)
![]()
Diese Datei und die Informationen unter dem roten Trennstrich werden aus dem zentralen Medienarchiv Wikimedia Commons eingebunden.
![]()
Beschreibung
| Beschreibung |
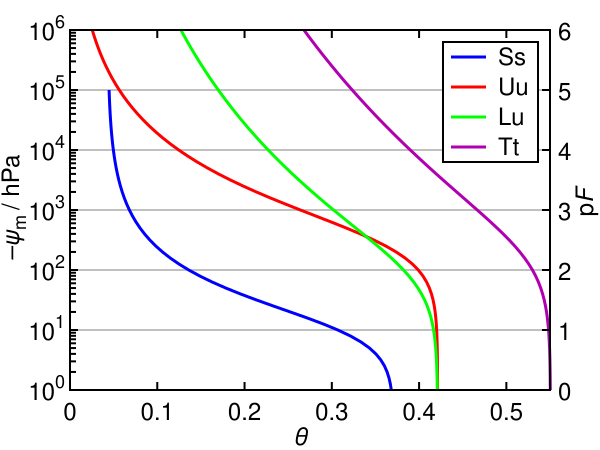
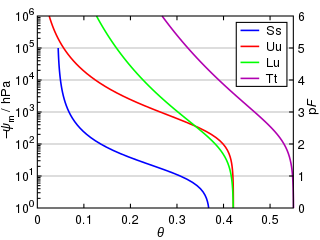
English: calculated diagram of soil with model formula (van Genuchten, 1980)
[1]
Deutsch: Der Saugdruck von Sand, Schluff, Lehm und Ton. Neu berechnetes Diagramm verschiedener Bodenarten mit Modelldaten gemäß van Genuchten, 1980 |
| Datum | |
| Quelle | Eigenes Werk |
| Urheber | FMoeckel, DufterKunde |
| Genehmigung (Weiternutzung dieser Datei) |
http://de.wikipedia.org/wiki/Datei:Wrc.svg |
| Andere Versionen | Wrc.jpg |
W3C-validity not checked.
Van Genuchten model of soil water retention ( – relative soil water content, – soil matric potential):


with

| Soil | Soil | |||||
|---|---|---|---|---|---|---|
| Ss | Sand | 0.043019 | 0.370687 | 0.087424 | 1.57535 | 0.36522 |
| Uu | Silt | 0 | 0.421256 | 0.003405 | 1.34475 | 0.25637 |
| Lu | Loam-Silt | 0 | 0.421217 | 0.013345 | 1.12614 | 0.11201 |
| Tt | Clay | 0 | 0.550541 | 0.006812 | 1.08155 | 0.07540 |


| GNU Octave source code |
|---|
function van_genuchten()
	%* Encdoing: UTF-8.
	%* Written by DufterKunde
	%  https://de.wikipedia.org/wiki/Benutzer:DufterKunde
	%  to produce a corrected version of
	%  https://commons.wikimedia.org/wiki/File:Wrc.svg .
	%  It is supposed to be run in GNU octave 4.0,
	%  but it should also work with older versions of octave as well.
	%  Only minor changes are needed to make it run with Matlab.
	%* The plot shows the matric potential Psi_m
	%  of different types of soil as a function of the
	%  relative soil water content theta.
	%  It is based on the equation and parameters from
	%  {{cite web
	%  | url=https://www.bgr.bund.de/DE/Themen/Boden/Netzwerke/Adhocag/Downloads/Ergaenzungsregel_1_18.pdf
	%  | title=Verknüpfungsregel 1.18 – Parameter für das Modell einer stetigen Funktion der θ(ψ)-Beziehung
	%  | accessdate=2015-07-29
	%  | author=Ad-hoc-AG Boden
	%  | coauthors=
	%  | date=2004-09-17
	%  | format=PDF, 242 KiB
	%  | publisher=Staatlichen Geologischen Dienste und BGR
	%  | language=German
	%  }}
	%  theta = theta_r + (theta_s - theta_r)/(1 + (alpha*(-psi))^n)^m
	%  with
	%  m     = 1 - 1/n .
	%* Ss = Sand, Uu = Silt, Lu = Loam-Silt, Tt = Clay.
	%* Compliance of the output with the svg-standard validated by:
	%  https://validator.w3.org/
	%  and practical functionality tested with
	%  - Mozilla Firefox for Ubuntu 40.0,
	%  - Chromium 43.0.2357.130 Ubuntu 15.04 (64-bit)
	%  - eog (“Eye of Gnome”) 3.14.4,
	%  - Inkscape 0.91 r13725, and
	%  - SVG Check: https://tools.wmflabs.org/svgcheck/ (rsvg 2.36.1).

	% parameters:
	pF         = [  0     6];
	N          = 10*diff(pF) + 1;
	psi        = -logspace(pF(1),pF(2),N);
	x          = [  0     0.55];
	y          = pF;
	X          = [ 70   550   ];
	Y          = [390   30   ];
	DY         = diff(Y)/diff(y);
	Tick       =   8;
	tick       =   6;
	lgnd_wdth  =  95;
	lgnd_hght  = 120;
	lgnd_strk  =  35;
	lgnd_pad   =   4;
	lgnd_Pad   =  12;
	today      = clock();

	% Sand:
	theta_r_ss = 0.043019;
	theta_s_ss = 0.370687;
	alpha_ss   = 0.087424;
	n_ss       = 1.57535;
	theta_ss   = theta_vg(psi, theta_r_ss, theta_s_ss, alpha_ss, n_ss);

	% Silt:
	theta_r_uu = 0;
	theta_s_uu = 0.421256;
	alpha_uu   = 0.003405;
	n_uu       = 1.34475;
	theta_uu   = theta_vg(psi, theta_r_uu, theta_s_uu, alpha_uu, n_uu);

	% Loam-Silt:
	theta_r_lu = 0;
	theta_s_lu = 0.421217;
	alpha_lu   = 0.013345;
	n_lu       = 1.12614;
	theta_lu   = theta_vg(psi, theta_r_lu, theta_s_lu, alpha_lu, n_lu);

	% Clay:
	theta_r_tt = 0;
	theta_s_tt = 0.550541;
	alpha_tt   = 0.006812;
	n_tt       = 1.08155;
	theta_tt   = theta_vg(psi, theta_r_tt, theta_s_tt, alpha_tt, n_tt);

	% generate svg-file:
	fid        = fopen ("Wrc.svg","w");
	fprintf(fid,["<?xml version=\"1.0\" encoding=\"utf-8\"?>\n", ...
	             "<svg\n", ...
	             "xmlns=\"http://www.w3.org/2000/svg\"\n", ...
	             "width=\"600\" height=\"450\"\n", ...
	             ">\n",...
	             "\t<title>Water Retention Curves</title>\n"]);
	fprintf(fid,["\t<desc>\n",...
	             "\t\t* This is a corrected version of\n",...
	             "\t\t  https://commons.wikimedia.org/wiki/File:Wrc.svg\n",...
	             "\t\t  generated by DufterKunde\n",...
	             "\t\t  https://de.wikipedia.org/wiki/Benutzer:DufterKunde\n",...
	             "\t\t  on %i-%02i-%02i.\n",...
	             "\t\t* The plot shows the matric potential Psi_m\n",...
	             "\t\t  of different types of soil as a function of the\n",...
	             "\t\t  relative soil water content theta.\n",...
	             "\t\t  It is based on the equation and parameters from\n",...
	             "\t\t  {{cite web\n",...
	             "\t\t  | url=https://www.bgr.bund.de/DE/Themen/Boden/Netzwerke/Adhocag/Downloads/Ergaenzungsregel_1_18.pdf\n",...
	             "\t\t  | title=Verknüpfungsregel 1.18 – Parameter für das Modell einer stetigen Funktion der θ(ψ)-Beziehung\n",...
	             "\t\t  | accessdate=2015-07-29\n",...
	             "\t\t  | author=Ad-hoc-AG Boden\n",...
	             "\t\t  | coauthors=\n",...
	             "\t\t  | date=2004-09-17\n",...
	             "\t\t  | format=PDF, 242 KiB\n",...
	             "\t\t  | publisher=Staatlichen Geologischen Dienste und BGR\n",...
	             "\t\t  | language=German\n",...
	             "\t\t  }}\n",...
	             "\t\t  theta = theta_r + (theta_s - theta_r)/(1 + (alpha*(-psi))^n)^m\n",...
	             "\t\t  with\n",...
	             "\t\t  m     = 1 - 1/n .\n",...
	             "\t\t* Ss = Sand, Uu = Silt, Lu = Loam-Silt, Tt = Clay.\n",...
	             "\t\t* This svg-file has been generated line-by-line\n",...
	             "\t\t  by a GNU Octave function.\n",...
	             "\t\t* Compliance with the svg standard validated by:\n",...
	             "\t\t  https://validator.w3.org/\n",...
	             "\t\t  and practical functionality tested with\n",...
	             "\t\t  - Mozilla Firefox for Ubuntu 40.0,\n",...
	             "\t\t  - Chromium 43.0.2357.130 Ubuntu 15.04 (64-bit)\n",...
	             "\t\t  - eog (“Eye of Gnome”) 3.14.4,\n",...
	             "\t\t  - Inkscape 0.91 r13725, and\n",...
	             "\t\t  - SVG Check: https://tools.wmflabs.org/svgcheck/ (rsvg 2.36.1).\n",...
	             "\t</desc>\n"],today(1),today(2),today(3));
	fprintf(fid,"\t<g shape-rendering=\"geometricPrecision\" stroke=\"black\" stroke-width=\"2\">\n");
	fprintf(fid,"\t\t<!-- horizontal grid lines: -->\n");
	fprintf(fid,"\t\t<g stroke=\"#c0c0c0\">\n");
	for k = (pF(1) + 1) : (pF(2) - 1)
		Y_grid = Y(1) + k * DY
		fprintf(fid,"\t\t\t<polyline points=\"%i,%i %i,%i\"/>\n",...
		        X(1),Y_grid,X(2),Y_grid);
	endfor
	fprintf(fid,"\t\t</g>\n");
	fprintf(fid,"\t\t<!-- actual graph data: -->\n");
	fprintf(fid,"\t\t<g fill=\"none\" stroke-width=\"3\">\n");
	write_svg_dat(fid,psi(1:end-10),theta_ss(1:end-10),x,y,X,Y,"0000ff","Ss = Sand");
	write_svg_dat(fid,psi,theta_uu,x,y,X,Y,"ff0000","Uu = Silt");
	write_svg_dat(fid,psi,theta_lu,x,y,X,Y,"00ff00","Lu = Loam-Silt");
	write_svg_dat(fid,psi,theta_tt,x,y,X,Y,"b000b0","Tt = Clay");
	fprintf(fid,"\t\t</g>\n");
	fprintf(fid,"\t\t<!-- ticks on x-axis: -->\n");
	for k = [0.1 : 0.1 : 0.5]
		X_grid = X(1) + k * diff(X)/diff(x)
		fprintf(fid,"\t\t<polyline points=\"%5.2f,%i %5.2f,%i\"/>\n",...
		        X_grid,Y(1),X_grid,Y(1)-Tick);
		fprintf(fid,"\t\t<polyline points=\"%5.2f,%i %5.2f,%i\"/>\n",...
		        X_grid,Y(2)+Tick,X_grid,Y(2));
	endfor
	fprintf(fid,"\t\t<!-- major ticks on y-axis: -->\n");
	for k = (pF(1) + 1) : (pF(2) - 1 )
		Y_grid = Y(1) + k * DY;
		fprintf(fid,"\t\t<polyline points=\"%i,%i %i,%i\"/>\n",...
		        X(1),Y_grid,X(1)+Tick,Y_grid);
		fprintf(fid,"\t\t<polyline points=\"%i,%i %i,%i\"/>\n",...
		        X(2)-Tick,Y_grid,X(2),Y_grid);
	endfor
	fprintf(fid,"\t\t<!-- minor log-ticks on left y-axis: -->\n");
	for k = pF(1) : (pF(2) - 1)
		for m = 2 : 9
			y_grid = Y(1) + ( k + log10(m) ) * DY;
			fprintf(fid,"\t\t<polyline points=\"%i,%5.2f %i,%5.2f\"/>\n",...
			        X(1),y_grid,X(1)+tick,y_grid);
		endfor
	endfor
	fprintf(fid,"\t\t<!-- legend: -->\n");
	fprintf(fid,["\t\t<rect x=\"%i\" y=\"%i\" width=\"%i\" " ,...
	             "height=\"%i\" stroke=\"black\" fill=\"white\"/>\n"],...
	        X(2)-lgnd_wdth-lgnd_Pad,Y(2)+lgnd_Pad,lgnd_wdth,lgnd_hght);
	Y_lgnd = Y(2)+1.5*Tick + [0.5 1.5 2.5 3.5]/4*lgnd_hght
	X_lgnd = [X(2)-lgnd_wdth-lgnd_pad X(2)-lgnd_wdth-lgnd_pad+lgnd_strk];
	fprintf(fid,"\t\t<g fill=\"none\" stroke-width=\"3\">\n");
	fprintf(fid,"\t\t\t<polyline stroke=\"#0000ff\" points=\"%i,%i %i,%i\"/>\n",...
	        X_lgnd(1),Y_lgnd(1),X_lgnd(2),Y_lgnd(1));
	fprintf(fid,"\t\t\t<polyline stroke=\"#ff0000\" points=\"%i,%i %i,%i\"/>\n",...
	        X_lgnd(1),Y_lgnd(2),X_lgnd(2),Y_lgnd(2));
	fprintf(fid,"\t\t\t<polyline stroke=\"#00ff00\" points=\"%i,%i %i,%i\"/>\n",...
	        X_lgnd(1),Y_lgnd(3),X_lgnd(2),Y_lgnd(3));
	fprintf(fid,"\t\t\t<polyline stroke=\"#b000b0\" points=\"%i,%i %i,%i\"/>\n",...
	        X_lgnd(1),Y_lgnd(4),X_lgnd(2),Y_lgnd(4));
	fprintf(fid,"\t\t</g>\n");
	fprintf(fid,"\t\t<!-- axis-box: -->\n");
	fprintf(fid,["\t\t<polygon points=\"%i,%i %i,%i %i,%i %i,%i\" ",...
	             "fill=\"none\" stroke=\"black\" stroke-width=\"2\"/>\n"],...
	        X(1),Y(2),X(2),Y(2),X(2),Y(1),X(1),Y(1));
	fprintf(fid,"\t\t<!-- text: -->\n");
	fprintf(fid,"\t\t<g stroke-width=\"0\" fill=\"black\" font-family=\"Helvetica\" font-size=\"24\">\n");
	fprintf(fid,"\t\t\t<!-- x-axis annotation: -->\n");
	fprintf(fid,"\t\t\t<text x=\"%i\" y=\"%i\" text-anchor=\"middle\" font-style=\"italic\">θ</text>\n",...
	        mean(X)-10,445);
	fprintf(fid,"\t\t\t<text x=\"%i\" y=\"%i\" text-anchor=\"middle\">0</text>\n",...
	        X(1),420);
	for k = [0.1 : 0.1 : 0.5]
		X_grid = X(1) + k * diff(X)/diff(x);
		fprintf(fid,"\t\t\t<text x=\"%i\" y=\"%i\" text-anchor=\"middle\">%3.1f</text>\n",...
		X_grid,420,k);
	endfor
	fprintf(fid,"\t\t\t<!-- y-axis annotation: -->\n");
	fprintf(fid,"\t\t\t<text x=\"%i\" y=\"%i\" transform=\"rotate(-90)\" text-anchor=\"end\">p</text>\n",...
	        -mean(Y)+ 7,593);
	fprintf(fid,"\t\t\t<text x=\"%i\" y=\"%i\" transform=\"rotate(-90)\" text-anchor=\"start\" font-style=\"italic\">F</text>\n",...
	        -mean(Y)+ 7,593);
	fprintf(fid,"\t\t\t<text x=\"%i\" y=\"%i\" transform=\"rotate(-90)\" text-anchor=\"end\" font-style=\"italic\">–ψ</text>\n",...
	        -mean(Y)-20,19);
	fprintf(fid,"\t\t\t<text x=\"%i\" y=\"%i\" transform=\"rotate(-90)\" text-anchor=\"start\" font-size=\"18\">m</text>\n",...
	        -mean(Y)-20,26);
	fprintf(fid,"\t\t\t<text x=\"%i\" y=\"%i\" transform=\"rotate(-90)\" text-anchor=\"start\">/ hPa</text>\n",...
	        -mean(Y)   ,19);
	for k = pF(1) : pF(2)
		Y_grid = Y(1) + k * DY;
		if ( k < 0 )
			fprintf(fid,"\t\t\t<text x=\"%i\" y=\"%i\" text-anchor=\"end\">–</text>\n",...
			        X(2)+8,Y_grid+10);
		endif
		fprintf(fid,"\t\t\t<text x=\"%i\" y=\"%i\" text-anchor=\"start\">%i</text>\n",...
		        X(2)+8,Y_grid+10,abs(k));
		fprintf(fid,"\t\t\t<text x=\"%i\" y=\"%i\" text-anchor=\"end\">10</text>\n",...
		        X(1)-15,Y_grid+10);
		if ( k >= 0 )
			fprintf(fid,"\t\t\t<text x=\"%i\" y=\"%i\" text-anchor=\"start\" font-size=\"18\">%i</text>\n",...
			        X(1)-15,Y_grid-2,k);
		else
			fprintf(fid,"\t\t\t<text x=\"%i\" y=\"%i\" text-anchor=\"start\" font-size=\"18\">–%i</text>\n",...
			        X(1)-15,Y_grid-2,-k);
		endif
	endfor
	fprintf(fid,"\t\t\t<!-- legend: -->\n");
	fprintf(fid,"\t\t\t<text x=\"%i\" y=\"%i\" text-anchor=\"start\">Ss</text>\n",...
	        X_lgnd(2)+lgnd_Pad,Y_lgnd(1)+8);
	fprintf(fid,"\t\t\t<text x=\"%i\" y=\"%i\" text-anchor=\"start\">Uu</text>\n",...
	        X_lgnd(2)+lgnd_Pad,Y_lgnd(2)+8);
	fprintf(fid,"\t\t\t<text x=\"%i\" y=\"%i\" text-anchor=\"start\">Lu</text>\n",...
	        X_lgnd(2)+lgnd_Pad,Y_lgnd(3)+8);
	fprintf(fid,"\t\t\t<text x=\"%i\" y=\"%i\" text-anchor=\"start\">Tt</text>\n",...
	        X_lgnd(2)+lgnd_Pad,Y_lgnd(4)+8);
	fprintf(fid,["\t\t</g>\n",...
	             "\t</g>\n",...
	             "</svg>"]);
	fclose(fid);

endfunction

function theta = theta_vg(psi, theta_r, theta_s, alpha, n)
	% van Genuchten equation
	m = 1 - 1/n
	theta = theta_r + (theta_s - theta_r)./(1 + (alpha*(-psi)).^n).^m;
endfunction

function write_svg_dat(fid,psi,theta,x,y,X,Y,cl,name)
	Y_dat = ( log10(-psi) - y(1) )*diff(Y)/diff(y) + Y(1);
	X_dat = ( theta       - x(1) )*diff(X)/diff(x) + X(1);
	fprintf(fid,"\t\t\t<polyline stroke=\"#%s\" points=\"",cl);
	for	k = 1 : (length(psi) - 1)
		fprintf(fid,"%4.2f,%i ",X_dat(k),Y_dat(k));
	endfor
	fprintf(fid,["%4.2f,%i\">\n",...
	             "\t\t\t\t<title>%s</title>\n",...
	             "\t\t\t</polyline>\n"],X_dat(end),Y_dat(end),name);
endfunction
|
Reference
- ↑ Ad-hoc-AG Boden (2004-09-17). Verknüpfungsregel 1.18 – Parameter für das Modell einer stetigen Funktion der θ(ψ)-Beziehung (in German) (PDF, 242 KiB). Staatlichen Geologischen Dienste und BGR. Archived from the original on 2016-03-04. Retrieved on 2015-07-29.
Lizenz
| Ich, der Urheberrechtsinhaber dieses Werkes, veröffentliche es als gemeinfrei. Dies gilt weltweit. In manchen Staaten könnte dies rechtlich nicht möglich sein. Sofern dies der Fall ist: Ich gewähre jedem das bedingungslose Recht, dieses Werk für jedweden Zweck zu nutzen, es sei denn, Bedingungen sind gesetzlich erforderlich. |
Dateiversionen
Klicke auf einen Zeitpunkt, um diese Version zu laden.
| Version vom | Vorschaubild | Maße | Benutzer | Kommentar | |
|---|---|---|---|---|---|
| aktuell | 15:18, 17. Aug. 2015 | | 600 × 450 (11 KB) | DufterKunde | Minor source code clean-up. |
| 15:44, 14. Aug. 2015 |  | 600 × 450 (10 KB) | DufterKunde | Restricted to a more realistic range of matric potential / pF-values. (Unfortunately, the original source does not mention in which intervals the model is valid.) | |
| 17:17, 13. Aug. 2015 |  | 600 × 450 (14 KB) | DufterKunde | The original file was based on a wrong equation due to a typo (see File talk:Wrc.svg#Plots seem to be based on wrong equation). This has been discussed with and confirmed by the original author User:FMoeckel~commonswiki via e-mail. The new SVG... | |
| 07:22, 7. Apr. 2011 |  | 512 × 405 (27 KB) | Trex2001 | resized font | |
| 13:41, 6. Apr. 2011 |  | 512 × 404 (26 KB) | Trex2001 | redone in SVG (was embedded bitmap before) | |
| 13:25, 6. Apr. 2011 |  | 512 × 724 (179 KB) | Trex2001 | Reverted to version as of 16:07, 9 January 2010 | |
| 13:16, 6. Apr. 2011 |  | 512 × 378 (180 KB) | Trex2001 | cropped | |
| 18:07, 9. Jan. 2010 |  | 512 × 724 (179 KB) | FMoeckel~commonswiki | {{Information |Description={{en|1=calculated diagram of soil with model formula (van Genuchten, 1980) <ref>[www.bgr.de/saf_boden/adhocag/Ergaenzungsregel_1_18.pdf]</ref>}} {{de|1=neu berechnetes Diagramm verschiedener Bodenarten mit Modelldaten gemäß va |
Dateiverwendung
Die folgenden 6 Seiten verwenden diese Datei:
Globale Dateiverwendung
Die nachfolgenden anderen Wikis verwenden diese Datei:
- Verwendung auf en.wikipedia.org
- Verwendung auf ja.wikipedia.org
- Verwendung auf nl.wikipedia.org
- Verwendung auf pl.wikipedia.org
- Verwendung auf ru.wikipedia.org
- Verwendung auf sv.wikipedia.org
- Verwendung auf zh.wikipedia.org