Datei:United States Income Distribution 1947-2007.svg

Größe der PNG-Vorschau dieser SVG-Datei: 800 × 320 Pixel. Weitere aus SVG automatisch erzeugte PNG-Grafiken in verschiedenen Auflösungen: 320 × 128 Pixel | 640 × 256 Pixel | 1.024 × 410 Pixel | 1.280 × 512 Pixel | 2.560 × 1.024 Pixel | 1.000 × 400 Pixel
Originaldatei (SVG-Datei, Basisgröße: 1.000 × 400 Pixel, Dateigröße: 19 KB)
![]()
Diese Datei und die Informationen unter dem roten Trennstrich werden aus dem zentralen Medienarchiv Wikimedia Commons eingebunden.
![]()
Beschreibung
| Beschreibung |
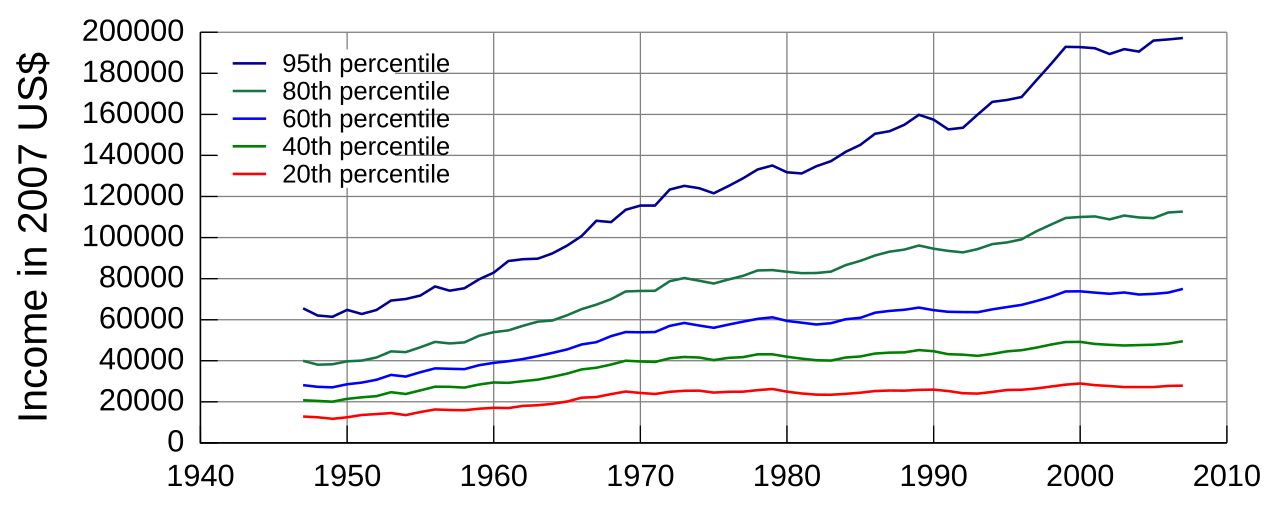
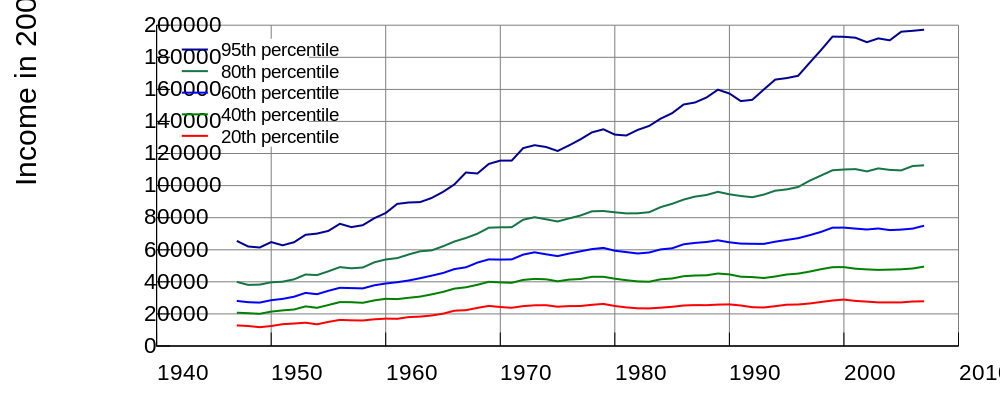
English: Graph of United States income distribution from 1947 through 2007 inclusive, normalized to 2007 dollars. The data source is "Table F-1. Income Limits for Each Fifth and Top 5 Percent of Families (All Races): 1947 to 2007", U.S. Census Bureau, Current Population Survey, Annual Social and Economic Supplements, as found at https://www.census.gov/hhes/www/income/histinc/f01AR.html[ Archivkopie in der Wayback Machine backup].
This work is entirely my own, built using gnuplot 4.2. I relinquish any and all copyright claims I might have, releasing the work into the public domain. |
| Datum | |
| Quelle | Eigenes Werk |
| Urheber | Alan De Smet |
Recreating and raw data
The following should allow others to recreate the graph using gnuplot 4.2 or later.
The data file entitled "income-distribution-data" is as follows:
# Data:
#   https://www.census.gov/hhes/www/income/histinc/f01AR.html
#   https://www.webcitation.org/query?url=http%3A%2F%2Fwww.census.gov%2Fhhes%2Fwww%2Fincome%2Fhistinc%2Ff01AR.html&date=2009-04-12
# Footnotes:
#   https://www.census.gov/hhes/www/income/histinc/ftnotes.html# Archivkopie in der Wayback Machine
#
# Historical Income Tables - Families
#  Table F-1. Income Limits for Each Fifth and Top 5 Percent of
#  Families (All Races):  1947 to 2007
#
#  (Families as of March of the following year.  Income in current
#  and 2007 CPI-U-RS adjusted dollars 28/)
#
#  Source: U.S. Census Bureau, Current Population Survey, Annual Social and Economic Supplements.
#
# The following data is always the 2007 CPI-U-RS adjusted dollars.

#Year "Number"    20%      40%      60%      80%      95%
2007   77908    27864    49510    75000   112638   197216
2006   78454    27766    48333    73220   112246   196480
2005   77418    27206    47816    72545   109501   195955
2004   76866    27192    47640    72248   109769   190603
2003   76232    27189    47413    73278   110707   191744
2002   75616    27661    47761    72610   108879   189388
2001   74340    28108    48166    73197   110264   192191
2000   73778    28897    49173    73837   110017   192790
1999   73206    28367    49143    73754   109547   192904
1998   71551    27439    47882    71164   106318   184452
1997   70884    26516    46371    69061   103046   176569
1996   70241    25897    45155    67224    99109   168436
1995   69597    25762    44560    66175    97618   167051
1994   69313    24819    43302    65023    96840   166075
1993   68506    23978    42390    63627    94379   159925
1992   68216    24199    42966    63709    92740   153498
1991   67173    25239    43219    63840    93519   152657
1990   66322    25907    44666    64652    94564   157414
1989   66090    25837    45207    65873    96145   159779
1988   65837    25435    44095    64841    94156   154946
1987   65204    25488    43967    64254    93113   151812
1986   64491    25270    43500    63391    91278   150535
1985   63558    24413    42057    60922    88628   145111
1984   62706    23902    41577    60223    86604   141796
1983   62015    23416    40107    58318    83390   137239
1982   61393    23516    40274    57661    82731   134741
1981   61019    24095    41016    58533    82688   131233
1980   60309    24916    41950    59415    83372   131766
1979   59550    26247    43160    61145    84195   135071
1978   57804    25690    43167    60433    84000   133175
1977   57215    24933    41754    59030    81333   128875
1976   56710    24867    41414    57606    79561   125047
1975   56245    24483    40314    56064    77625   121590
1974   55698    25433    41553    57176    78980   124052
1973   55053    25365    41854    58397    80309   125200
1972   54373    24874    41221    56977    78718   123378
1971   53296    23789    39389    53988    74039   115614
1970   52227    24303    39647    53843    74009   115558
1969   51586    25000    40000    54000    73755   113515
1968   50823    23733    38128    52021    69988   107541
1967   50111    22303    36611    49095    67305   108144
1966   49214    22026    35812    47931    65154   100754
1965   48509    20147    33748    45531    62166    96099
1964   47956    18995    32145    43834    59620    92273
1963   47540    18341    30805    42263    59058    89715
1962   47059    18018    30030    40840    57056    89488
1961   46418    16984    29237    39791    54804    88560
1960   45539    17057    29408    38991    53915    82932
1959   45111    16670    28426    37866    52182    79706
1958   44232    15884    26940    35912    48971    75340
1957   43696    16051    27315    36088    48417    74151
1956   43497    16244    27338    36267    49173    76212
1955   42889    15029    25578    34388    46575    71761
1954   41951    13554    23841    32276    44220    70075
1953   41202    14539    24673    33108    44588    69342
1952   40832    14048    22725    30744    41583    64698
1951   40578    13608    22186    29349    40073    62802
1950   39929    12488    21473    28578    39720    64772
1949   39303    11746    20067    27070    38253    61402
1948   38624    12443    20458    27315    38104    62050
1947   37237    12862    20755    28144    39934    65545
The files "commands is as follows:
set terminal svg size 1000 400 enhanced fname "Arial" fsize 18
set grid back lw 1
set border 3
set logscale y
set format y "%6.0f"
set yrange [10000:500000]
set ytics nomirror 10000,2,500000
set xtics nomirror
set key top left Left reverse width -8 spacing 0.8 samplen 1
set ylabel "Income in 2007 US$" font "Arial,24"
set size ratio 0.4
# Skipping linetype (lt) 4; it's cyan and not very dark against white backgrounds.
plot \
 "income-distribution-data" using 1:7 with lines lw 2 lt 6 title "{/Arial=15 95th percentile}",\
 "income-distribution-data" using 1:6 with lines lw 2 lt 5 title "{/Arial=15 80th percentile}",\
 "income-distribution-data" using 1:5 with lines lw 2 lt 3 title "{/Arial=15 60th percentile}",\
 "income-distribution-data" using 1:4 with lines lw 2 lt 2 title "{/Arial=15 40th percentile}",\
 "income-distribution-data" using 1:3 with lines lw 2 lt 1 title "{/Arial=15 20th percentile}"
To create the graph, the follow command was used:
gnuplot < commands > out.svg
Lizenz
| Ich, der Urheberrechtsinhaber dieses Werkes, veröffentliche es als gemeinfrei. Dies gilt weltweit. In manchen Staaten könnte dies rechtlich nicht möglich sein. Sofern dies der Fall ist: Ich gewähre jedem das bedingungslose Recht, dieses Werk für jedweden Zweck zu nutzen, es sei denn, Bedingungen sind gesetzlich erforderlich. |
Dateiversionen
Klicke auf einen Zeitpunkt, um diese Version zu laden.
| Version vom | Vorschaubild | Maße | Benutzer | Kommentar | |
|---|---|---|---|---|---|
| aktuell | 17:58, 22. Feb. 2011 | 1.000 × 400 (19 KB) | TomSwiss | Undoing change to logarithmic scale, which obfuscates the actual trend of the data | |
| 23:51, 3. Jan. 2010 | 1.000 × 400 (17 KB) | Ariel. | Convert to logarithmic scale. Linear scale is very misleading for this graph. | ||
| 20:15, 12. Apr. 2009 | 1.000 × 400 (19 KB) | Alan De Smet | Typo in input files caused last data point to disappear. Fixed. | ||
| 20:12, 12. Apr. 2009 | 1.000 × 400 (19 KB) | Alan De Smet | {{Information |Description={{en|1=Graph of United States income distribution from 1947 through 2007 inclusive, normalized to 2007 dollars. The data source is "Table F-1. Income Limits for Each Fifth and Top 5 Percent of Families (All Races): 1947 to 2007 |
Dateiverwendung
Die folgende Seite verwendet diese Datei:
Globale Dateiverwendung
Die nachfolgenden anderen Wikis verwenden diese Datei:
- Verwendung auf en.wikipedia.org