Datei:Global sea level rise from 1992 to 2020, satellite data chart.svg

Größe der PNG-Vorschau dieser SVG-Datei: 800 × 540 Pixel. Weitere aus SVG automatisch erzeugte PNG-Grafiken in verschiedenen Auflösungen: 320 × 216 Pixel | 640 × 432 Pixel | 1.024 × 691 Pixel | 1.280 × 864 Pixel | 2.560 × 1.728 Pixel
Originaldatei (SVG-Datei, Basisgröße: 800 × 540 Pixel, Dateigröße: 59 KB)
![]()
Diese Datei und die Informationen unter dem roten Trennstrich werden aus dem zentralen Medienarchiv Wikimedia Commons eingebunden.
![]()
Beschreibung
| Beschreibung |
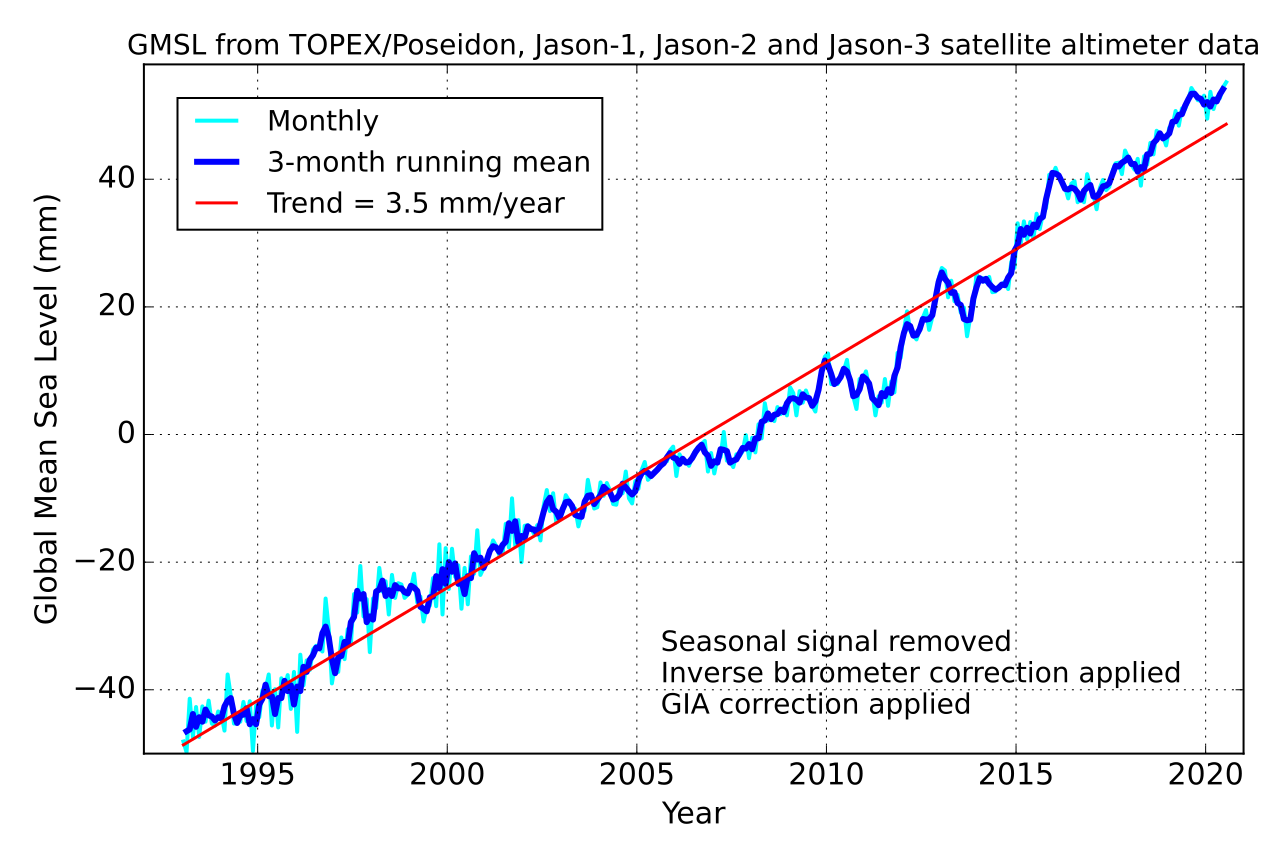
English: The image shows the development of global sea level from 1992 to 2020. Seasonal variations were removed. Measurements have been conducted via satellites TOPEX/Poseidon, Jason-1 and Jason 2. The trend line clearly shows the constant increase in global sea level of 3.5 ± 0.3 mm/year since the 1990s. The raw data is from http://www.cmar.csiro.au/sealevel/sl_hist_last_decades.html . |
| Datum | |
| Quelle | Eigenes Werk |
| Urheber | Geek3 |
| Andere Versionen | Alt gmsl seas not rem.svg with seasonal variations not removed. |
| SVG‑Erstellung | Dieser Plot wurde mit Matplotlib erstellt. |
| Quelltext | Python code#! /usr/bin/env python
# -*- coding:utf8 -*-
import matplotlib.pyplot as plt
import numpy as np
from scipy import stats
from math import *
plt.style.use('classic')
# download data from ftp://ftp.marine.csiro.au/pub/legresy/gmsl_files/CSIRO_Alt.csv
data = []
with open('CSIRO_Alt.csv', 'r') as csv:
for txt in csv.readlines():
try:
line = [i.strip() for i in txt.split(',')]
if len(line) == 3:
data.append(line)
except Exception:
pass
years0, h0 = [], []
years1, h1 = [], []
for d in data:
try:
y, h = float(d[0]), float(d[1])
years0.append(y); h0.append(h)
except Exception:
pass
try:
y, h = float(d[0]), float(d[2])
years1.append(y); h1.append(h)
except Exception:
pass
years0 = np.array(years0)
slope, intercept, r_value, p_value, std_err = stats.linregress(years0, h0)
plt.rc('font', size=15)
fig = plt.figure(figsize=(800 / 90.0, 540 / 90.0), dpi=72)
plt.plot(years0, h0, '-', color='#00eeee', linewidth=2, label='Monthly')
plt.plot(years1, h1, '-', color='#0000dd', linewidth=3, label='3-month running mean')
plt.plot(years0[[0,-1]], intercept+slope*np.array(years0[[0,-1]]), '-',
color='red', linewidth=1.5, label='Trend = {:.1f} mm/year'.format(slope))
plt.grid(True)
plt.xlim(1992, ceil(max(years0)/1.)*1.)
plt.gca().ticklabel_format(useOffset=False)
plt.ylim(-50, 59)
plt.gca().ticklabel_format(useOffset=False)
plt.xlabel('Year')
plt.ylabel('Global Mean Sea Level (mm)')
plt.title('GMSL from TOPEX/Poseidon, Jason-1, Jason-2 and Jason-3 satellite altimeter data', size=14)
plt.legend(loc='upper left', prop={'size':14}, borderaxespad=1.2)
plt.text(0.47, 0.058, '''Seasonal signal removed
Inverse barometer correction applied
GIA correction applied''', size=14, transform=plt.gca().transAxes)
plt.tight_layout()
plt.savefig('Alt_gmsl_seas_rem.svg')
|

|
Diese Datei könnte aktualisiert werden, um neue Informationen zu berücksichtigen. Falls die Verwendung einer bestimmten, nicht aktualisierten Version der Datei gewünscht wird, sollte die gewünschte Version separat hochgeladen werden. |
Lizenz
Ich, der Urheber dieses Werkes, veröffentliche es unter der folgenden Lizenz:
Diese Datei ist lizenziert unter der Creative-Commons-Lizenz „Namensnennung – Weitergabe unter gleichen Bedingungen 4.0 international“.
- Dieses Werk darf von dir
- verbreitet werden – vervielfältigt, verbreitet und öffentlich zugänglich gemacht werden
- neu zusammengestellt werden – abgewandelt und bearbeitet werden
- Zu den folgenden Bedingungen:
- Namensnennung – Du musst angemessene Urheber- und Rechteangaben machen, einen Link zur Lizenz beifügen und angeben, ob Änderungen vorgenommen wurden. Diese Angaben dürfen in jeder angemessenen Art und Weise gemacht werden, allerdings nicht so, dass der Eindruck entsteht, der Lizenzgeber unterstütze gerade dich oder deine Nutzung besonders.
- Weitergabe unter gleichen Bedingungen – Wenn du das Material wiedermischst, transformierst oder darauf aufbaust, musst du deine Beiträge unter der gleichen oder einer kompatiblen Lizenz wie das Original verbreiten.
Dateiversionen
Klicke auf einen Zeitpunkt, um diese Version zu laden.
| Version vom | Vorschaubild | Maße | Benutzer | Kommentar | |
|---|---|---|---|---|---|
| aktuell | 15:57, 22. Sep. 2023 | | 800 × 540 (59 KB) | Geek3 | fix problem with x ticklabels |
| 15:54, 22. Sep. 2023 |  | 800 × 540 (58 KB) | Geek3 | data update 2020 | |
| 15:19, 18. Feb. 2019 |  | 800 × 540 (67 KB) | Geek3 | update 2018 | |
| 21:02, 8. Apr. 2018 |  | 800 × 540 (69 KB) | Geek3 | User created page with UploadWizard |
Dateiverwendung
Die folgende Seite verwendet diese Datei: