Datei:Beta distribution pdf.svg

Größe der PNG-Vorschau dieser SVG-Datei: 531 × 425 Pixel. Weitere aus SVG automatisch erzeugte PNG-Grafiken in verschiedenen Auflösungen: 300 × 240 Pixel | 600 × 480 Pixel | 960 × 768 Pixel | 1.280 × 1.024 Pixel | 2.559 × 2.048 Pixel
Originaldatei (SVG-Datei, Basisgröße: 531 × 425 Pixel, Dateigröße: 80 KB)
![]()
Diese Datei und die Informationen unter dem roten Trennstrich werden aus dem zentralen Medienarchiv Wikimedia Commons eingebunden.
![]()
Beschreibung
| Beschreibung |
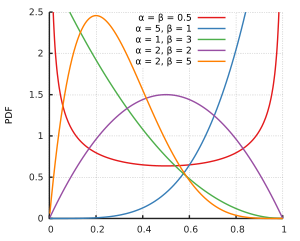
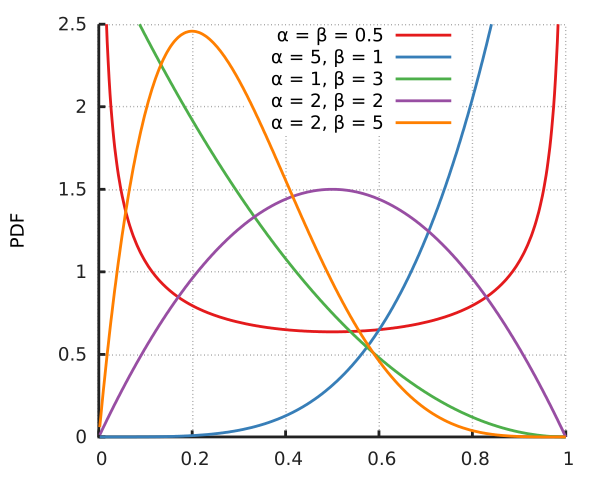
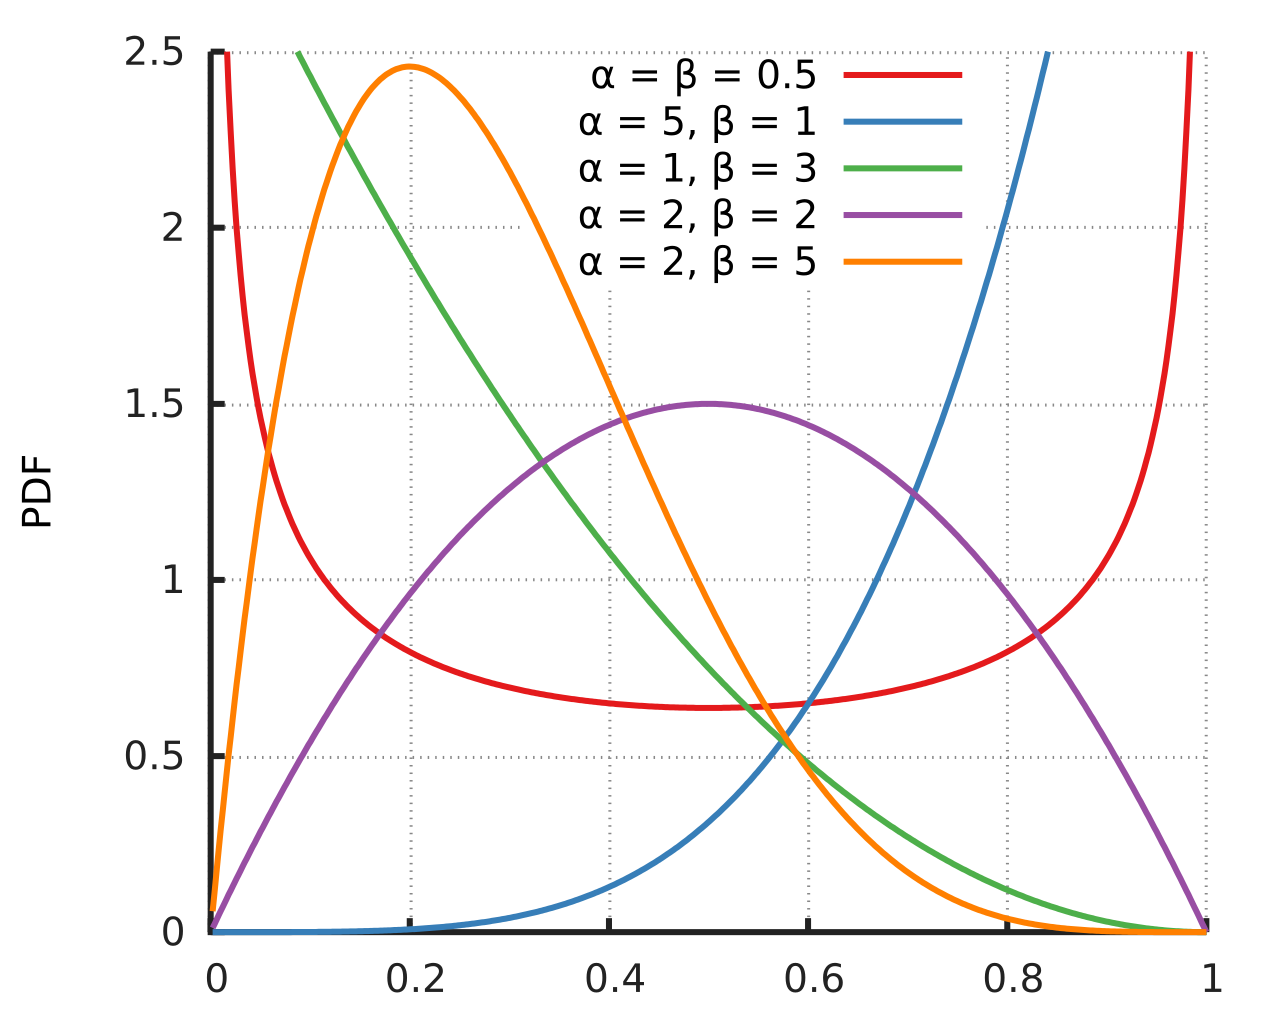
English: Probability density function for the Beta distribution. Created using Gnuplot. |
||||
| Datum | |||||
| Quelle | Eigenes Werk | ||||
| Urheber | Horas based on the work of Krishnavedala | ||||
| Andere Versionen | File:Beta_distribution_pdf.png | ||||
| SVG‑Erstellung | |||||
| Quelltext | Gnuplot code
Data
|
Lizenz
| Diese Datei ist gemeinfrei („public domain“), weil sie nur Allgemeingut enthält und die nötige Schöpfungshöhe nicht erreicht. |
Dateiversionen
Klicke auf einen Zeitpunkt, um diese Version zu laden.
| Version vom | Vorschaubild | Maße | Benutzer | Kommentar | |
|---|---|---|---|---|---|
| aktuell | 15:10, 14. Nov. 2014 | | 531 × 425 (80 KB) | Horas | {{Information |Description={{en|1=Probability density function for the Beta distribution. Created using the following code: reset reset session out=2 outputpath= "./" outputfilename="betadistribution" if(out==1) {... |
| 23:45, 4. Jun. 2011 |  | 639 × 489 (68 KB) | Krishnavedala | {{Information |Description ={{en|1=Probability density function for the Beta distribution. Created using python with matplotlib, scipy and numpy toolboxes. <syntaxhighlight lang=" |
Dateiverwendung
Die folgende Seite verwendet diese Datei:
Globale Dateiverwendung
Die nachfolgenden anderen Wikis verwenden diese Datei:
- Verwendung auf be.wikipedia.org
- Verwendung auf ca.wikipedia.org
- Verwendung auf en.wikipedia.org
- Verwendung auf en.wikibooks.org
- Verwendung auf en.wiktionary.org
- Verwendung auf fi.wikipedia.org
- Verwendung auf he.wikipedia.org
- Verwendung auf it.wikipedia.org
- Verwendung auf ja.wikipedia.org
- Verwendung auf ko.wikipedia.org
- Verwendung auf pt.wikipedia.org
- Verwendung auf tl.wikipedia.org
- Verwendung auf tr.wikipedia.org
- Verwendung auf uk.wikipedia.org
- Verwendung auf zh.wikipedia.org