Datei:Base rate fallacy with vaccines.svg

Größe der PNG-Vorschau dieser SVG-Datei: 800 × 347 Pixel. Weitere aus SVG automatisch erzeugte PNG-Grafiken in verschiedenen Auflösungen: 320 × 139 Pixel | 640 × 277 Pixel | 1.024 × 444 Pixel | 1.280 × 555 Pixel | 2.560 × 1.109 Pixel | 3.000 × 1.300 Pixel
Originaldatei (SVG-Datei, Basisgröße: 3.000 × 1.300 Pixel, Dateigröße: 11 KB)
![]()
Diese Datei und die Informationen unter dem roten Trennstrich werden aus dem zentralen Medienarchiv Wikimedia Commons eingebunden.
![]()
Beschreibung
| Beschreibung |
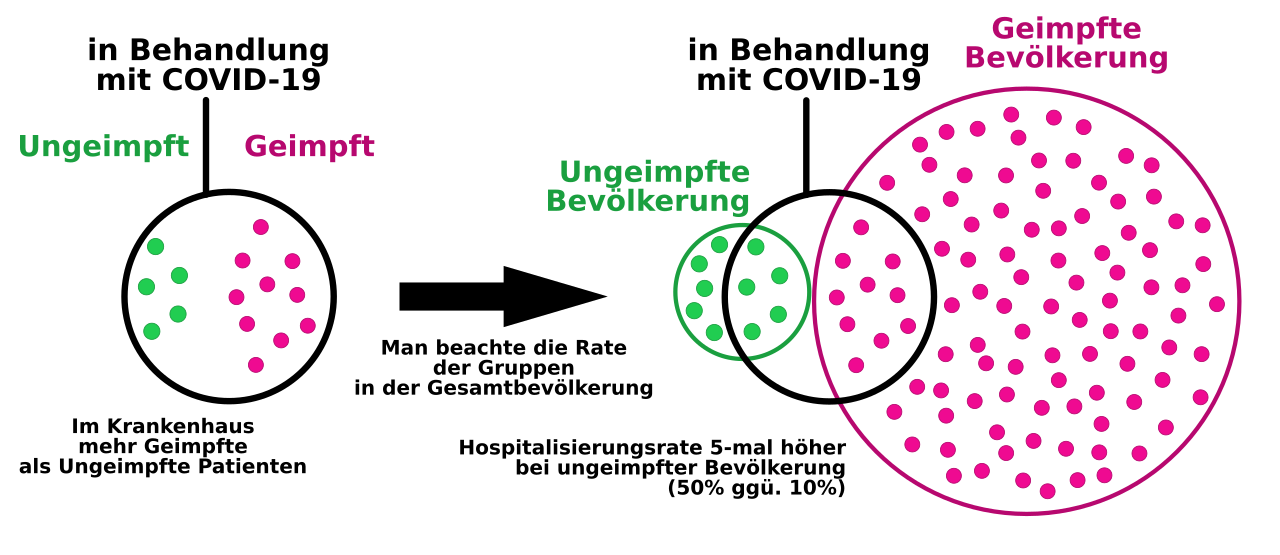
English: Diagram showing an example of the base rate fallacy, using Covid hospitalization rates. The 50% versus 10% hospitalization rates are extremely exaggerated and should be read as just an illustration. Covid never had a 50% hospitalization rate. A better comparison would use more realistic hospitalization rates in different age groups. After testing became less common it is highly uncertain how many people are infected with covid. The effectiveness of the commonly used vaccines against the novel variants of covid is likewise uncertain. In the example, there are more vaccinated people than unvaccinated people hospitalized (leftmost circle), but that's only because in the general population there are more vaccinated people than unvaccinated (rightmost diagram, with green circle representing the unvaccinated population, pink circle representing the vaccinated population, and the black circle representing hospitalized people. This diagram is just a visual made to illustrate the concept, not a specific data set.
Português: Diagrama mostrando um exemplo da falácia da taxa-base, usando as taxas de hospitalização da Covid. As taxas de hospitalização de 50% contra 10% são extremamente exageradas e devem ser lidas apenas como ilustração. A Covid nunca teve uma taxa de hospitalização de 50%. Uma comparação melhor utilizaria taxas de internação mais realistas em diferentes faixas etárias. Depois que os testes se tornaram menos comuns, é altamente incerto quantas pessoas estão infectadas com cobiça. A eficácia das vacinas habitualmente utilizadas contra as novas variantes da covid-19 também é incerta. No exemplo, há mais pessoas vacinadas do que não vacinadas hospitalizadas (círculo mais à esquerda), mas isso ocorre apenas porque na população em geral há mais pessoas vacinadas do que não vacinadas (diagrama mais à direita, com o círculo verde representando a população não vacinada, o círculo rosa representando a população vacinada população e o círculo preto representando pessoas hospitalizadas. Este diagrama é apenas um elemento visual feito para ilustrar o conceito, não um conjunto de dados específico. |
| Datum | |
| Quelle |
|
| Urheber |
|
| Andere Versionen | File:Base rate fallacy with vaccines.svg has 3 embedded translations. |
| SVG‑Erstellung |


Lizenz
Diese Datei ist lizenziert unter der Creative-Commons-Lizenz „Namensnennung 4.0 international“.
- Dieses Werk darf von dir
- verbreitet werden – vervielfältigt, verbreitet und öffentlich zugänglich gemacht werden
- neu zusammengestellt werden – abgewandelt und bearbeitet werden
- Zu den folgenden Bedingungen:
- Namensnennung – Du musst angemessene Urheber- und Rechteangaben machen, einen Link zur Lizenz beifügen und angeben, ob Änderungen vorgenommen wurden. Diese Angaben dürfen in jeder angemessenen Art und Weise gemacht werden, allerdings nicht so, dass der Eindruck entsteht, der Lizenzgeber unterstütze gerade dich oder deine Nutzung besonders.
Dateiversionen
Klicke auf einen Zeitpunkt, um diese Version zu laden.
| Version vom | Vorschaubild | Maße | Benutzer | Kommentar | |
|---|---|---|---|---|---|
| aktuell | 02:26, 15. Mai 2024 | | 3.000 × 1.300 (11 KB) | Vinickw | added Portuguese translation // Editing SVG source code using c:User:Rillke/SVGedit.js |
| 13:32, 10. Okt. 2023 |  | 3.000 × 1.300 (10 KB) | Opencooper | fix typo in "hospitalization"; change from pedantic "look" to more encyclopedic "looking" | |
| 13:21, 10. Okt. 2023 |  | 3.000 × 1.300 (10 KB) | Opencooper | capitalize and use full name for "COVID-19" | |
| 19:00, 18. Feb. 2023 |  | 3.000 × 1.300 (10 KB) | Mrmw | ||
| 21:02, 17. Feb. 2023 |  | 3.000 × 1.300 (9 KB) | Mrmw | svg for File:Base rate fallacy with vaccines |
Dateiverwendung
Die folgenden 2 Seiten verwenden diese Datei:
Globale Dateiverwendung
Die nachfolgenden anderen Wikis verwenden diese Datei:
- Verwendung auf en.wikipedia.org
- Verwendung auf pt.wikipedia.org