Datei:Correlation examples.png

Größe dieser Vorschau: 800 × 336 Pixel. Weitere Auflösungen: 320 × 134 Pixel | 824 × 346 Pixel
Originaldatei (824 × 346 Pixel, Dateigröße: 15 KB, MIME-Typ: image/png)
![]()
Diese Datei und die Informationen unter dem roten Trennstrich werden aus dem zentralen Medienarchiv Wikimedia Commons eingebunden.
![]()
| Beschreibung | See below. |
| Datum | 8. Dezember 2007 (Original-Hochladedatum) |
| Quelle |
Übertragen aus en.wikipedia nach Commons durch jtneill. Dieses Diagramm wurde mit Mathematica erstellt. |
| Urheber | Imagecreator in der Wikipedia auf Englisch |
| Andere Versionen | File:CovrarianceCorrelation.svg, File:Correlation examples2.svg |

|
File:Correlation examples2.svg ist eine vektorisierte Version dieses Bildes. Diese sollte an Stelle des Rasterbildes verwendet werden, sofern sie nicht schlechter ist.
File:Correlation examples.png → File:Correlation examples2.svg
Für weitere Informationen siehe Help:SVG. |
 |
|
|
[[:File:CovrarianceCorrelaخن
tion.svg]] ist eine vektorisierte Version dieses Bildes.
Fehler: Ein SVG-Bild dieses Namens gibt es nicht. Bitte verwende das richtige Format: {{Vector version available|Dateiname}}. File:Correlation examples.png → [[:File:CovrarianceCorrelaخن
tion.svg]]
Für weitere Informationen siehe Help:SVG. |
[[File:CovrarianceCorrelaخن
tion.svg|Neue Vektorgrafik|150x150px]] |
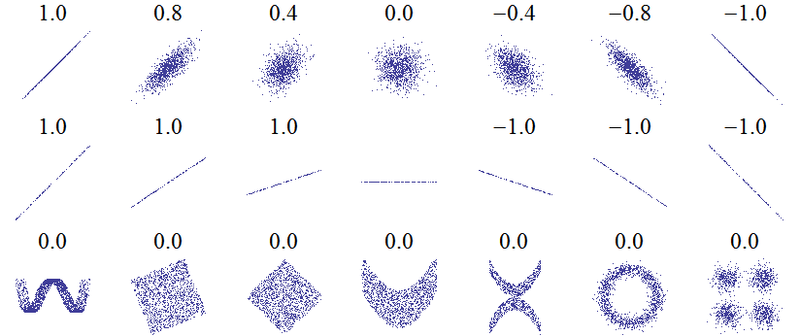
Beschreibung
An example of the correlation of x and y for various distributions of (x,y) pairs. It was created by this Mathematica 6 code, which I wrote and release into the public domain (needs makePlot!):
n = 2000;
GraphicsArray[{
  Table[makePlot[
    Table[{RandomReal[NormalDistribution[0, 1]], (1 - Abs[w])*
        RandomReal[NormalDistribution[0, 1]]} .
      RotationMatrix[-Sign[w]*Pi/4], {i, -1, 1, 2./n}], 1000], {w,
    1, -1, -1/3}],
  Table[makePlot[Table[{x, slope*x}, {x, -1, 1, 2./n}], 100], {slope,
    1, -1, -1/3}],
  {
   makePlot[
    Table[{x + RandomReal[]/3,
      4 (x^2 - 1/2)^2 + RandomReal[]/500} , {x, -1, 1, 2./n}], 2000],
   makePlot[
    Table[{RandomReal[{-1, 1}], RandomReal[{-1, 1}]} .
      RotationMatrix[-Pi/8], {x, -1, 1, 2./n}], 1400],
   makePlot[
    Table[{RandomReal[{-1, 1}], RandomReal[{-1, 1}]} .
      RotationMatrix[-Pi/4], {x, -1, 1, 2./n}], 1400],
   makePlot[Table[{x, x^2 + RandomReal[]}/2, {x, -1, 1, 2./n}],
    1400],
   makePlot[
    Table[{x, x^2 + RandomReal[]/2}*(RandomInteger[1]*2 - 1), {x, -1,
      1, 2./n}], 1000],
   makePlot[
    Table[{Sin[x*Pi] + RandomReal[NormalDistribution[0, 1/8]],
      Cos[x*Pi] + RandomReal[NormalDistribution[0, 1/8]]}, {x, -1, 1,
      2./n}], 1400],
   makePlot[
    Table[{RandomReal[NormalDistribution[0, 1/3]],
       RandomReal[
        NormalDistribution[0, 1/3]]} + {RandomInteger[1]*2 - 1,
       RandomInteger[1]*2 - 1}, {x, -1, 1, 2./n}], 1400]
   }
  }]
Lizenz
| Dieses Werk wurde von seinem Urheber Imagecreator in der Wikipedia auf Englisch als gemeinfrei veröffentlicht. Dies gilt weltweit. In manchen Staaten könnte dies rechtlich nicht möglich sein. Sofern dies der Fall ist: Imagecreator gewährt jedem das bedingungslose Recht, dieses Werk für jedweden Zweck zu nutzen, es sei denn, Bedingungen sind gesetzlich erforderlich. |
Ursprüngliches Datei-Logbuch
Die ursprüngliche Dateibeschreibungsseite war hier. Alle folgenden Benutzernamen beziehen sich auf en.wikipedia.
- 2007-12-08 19:16 Imagecreator 824×346×8 (20371 bytes) == Summary == An example of the correlation of x and y for various distributions of (x,y) pairs. It was created by this Mathematica 6 code, which I wrote and release into the public domain: <pre> (*Several sets of (x,y) points, with the correlation coef
- 2007-12-08 18:48 Imagecreator 824×346×8 (21374 bytes) An example of the correlation of x and y for various distributions of (x,y) pairs. It was created by this Mathematica 6 code, which I wrote and release into the public domain: (*Several sets of (x,y) points, with the correlation coefficient of x \ and y
Dateiversionen
Klicke auf einen Zeitpunkt, um diese Version zu laden.
| Version vom | Vorschaubild | Maße | Benutzer | Kommentar | |
|---|---|---|---|---|---|
| aktuell | 11:33, 2. Feb. 2010 | | 824 × 346 (15 KB) | JBW | Removing "0.0" for correlation coefficient from horizontal line: here corr. coeff. is undefined. |
| 12:27, 18. Mär. 2008 |  | 824 × 346 (20 KB) | Jtneill | {{Information |Description={{en|An example of the correlation of x and y for various distributions of (x,y) pairs. It was created by this Mathematica 6 code, which I wrote and release into the public domain: n = 2000; GraphicsArray[{ Table[makePlot[ |
Dateiverwendung
Die folgende Seite verwendet diese Datei:
Globale Dateiverwendung
Die nachfolgenden anderen Wikis verwenden diese Datei:
- Verwendung auf ar.wikipedia.org
- Verwendung auf bg.wikipedia.org
- Verwendung auf de.wikibooks.org
- Mathematrix: AT BRP/ Theorie/ Reifeniveau 6
- Mathematrix: MA TER/ Theorie/ Statistik und Wahrscheinlichkeitsrechnung
- Mathematrix: AT BRP/ Theorie nach Thema/ Statistik und Wahrscheinlichkeitsrechnung
- Mathematrix: AT AHS/ Theorie nach Thema/ Statistik und Wahrscheinlichkeitsrechnung
- Mathematrix: BY GYM/ Theorie nach Thema/ Statistik und Wahrscheinlichkeitsrechnung
- Verwendung auf en.wikipedia.org
- Verwendung auf hi.wikipedia.org
- Verwendung auf it.wikipedia.org
- Verwendung auf lt.wikipedia.org
- Verwendung auf pl.wikipedia.org
- Verwendung auf th.wikipedia.org
- Verwendung auf tr.wikipedia.org